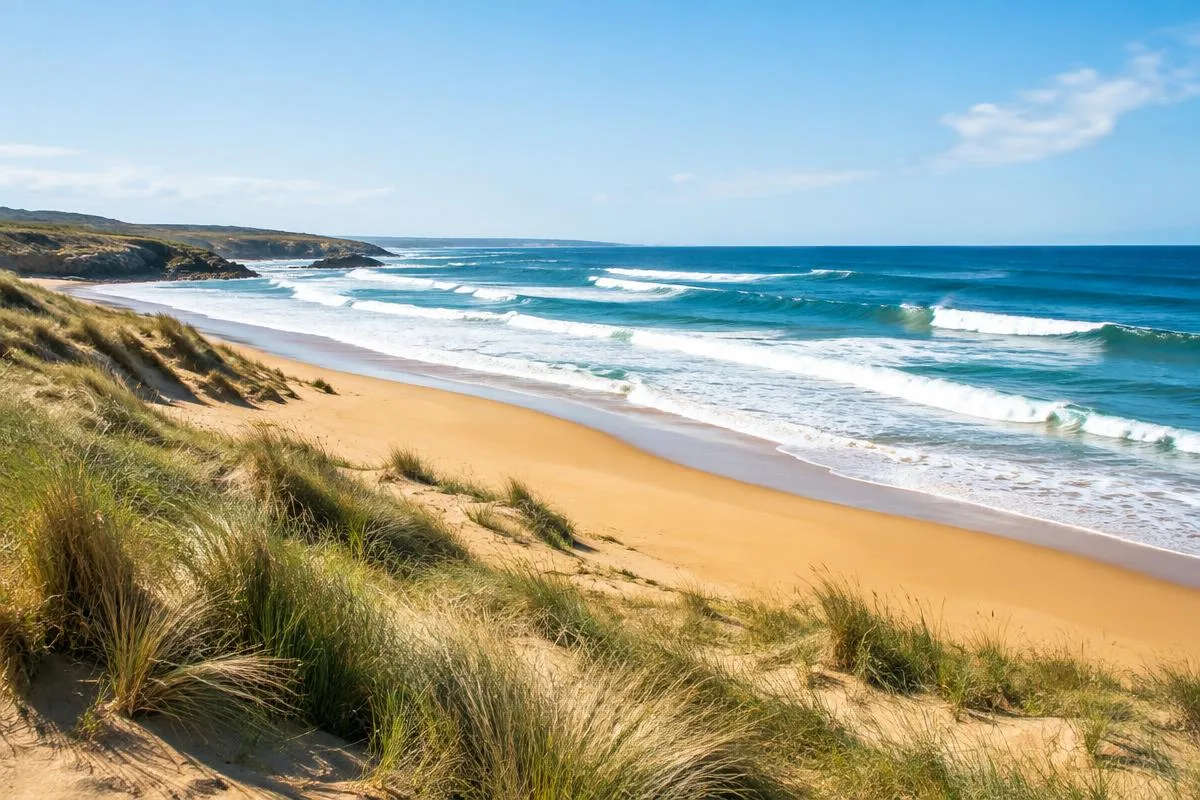
 AI-generated
Sayulita at a glance
- Best time
- Nov – May
- Warmest month
- Jul · 31°
- Warmest sea
- Aug · 30.4°
- Sunshine a year
- 2,690 h
- Rain a year
- 1,053 mm
- Climate
- Tropical
- Time zone
- UTC−6
- Elevation
- 34 m
Climate in Sayulita
Sayulita has a tropical climate: it is warm all year round, and the seasons differ mainly in how much rain falls. July is the warmest month with average highs of 31 °C, while January is the coolest at 27 °C. With around 2,690 hours of sunshine a year, Sayulita is sunny; April is the sunniest month with 9.0 hours a day.
Holiday weather through the year
Best time to visit Sayulita
The best time to visit Sayulita is from November to May. For a beach holiday – sea from 21 °C, warm and mostly dry – go from November to June. For sightseeing, day trips and hiking, conditions are most comfortable from December to March. The rainy season is from June to October; the wettest month is August with 276 mm.
Sayulita through the seasons
How the weather changes over the seasons, with averages for each.
Sayulita in the dry season
Nov – May
Excellent
- 27–31 °C by day
- Sea 26 °C
- 8.0 h of sun a day
- 9 rainy days in all
Sayulita in the rainy season
Jun – Oct
Good
- 30–31 °C by day
- Sea 30 °C
- 6.4 h of sun a day
- 96 rainy days in all
Which month for what?
Beach & swimming
Nov – Jun
Sea from 21 °C, warm and mostly dry
Sightseeing & hiking
Dec – Mar
15–28 °C and not too much rain
Rainy months
Jun – Oct
Rainy season or more than 12 rainy days
Find your perfect month
Tell us what you like and we rate every month in Sayulita for you.
Your best months: March – April, November
Based on the climate averages; tap a month to see its details.
Weather in October
Weather in October
Holiday weather in October
Excellent
Best time to visit: November – May
October is in the hurricane season Hurricane season
Where to go in OctoberSea temperature in October
Keep in mindFrequent rainStorm season
A typical day in October
- Morning, 08:00: about 24°
- Midday, 13:00: about 30°
- Afternoon, 16:00: about 30°
- Evening, 20:00: about 27°
- Night, 23:00: about 25°
06:5618:38
Warm enough for a T-shirt in the evening.
Estimated from the average high and low: coolest around sunrise, warmest in mid-afternoon.
Light for photos in October
- Golden hour
- Morning 06:43–07:26 · evening 18:09–18:52
- Blue hour
- Morning 06:34–06:43 · evening 18:52–19:01
Golden hour: the sun between 4° below and 6° above the horizon; blue hour: 6° to 4° below it. Times for the 15th of the month; mountains and clouds shift the light.
October in Sayulita compared with home
Loading the climate at home …
Early or late October?
In October, daytime highs stay at about 30° from start to end. The sea cools from 30° to 29°. The days get 0.6 h shorter.
| October | 1 Oct | 31 Oct |
|---|---|---|
| Daytime high | 30° | 30° |
| Night-time low | 23° | 21° |
| Sea | 30° | 29° |
| Daylight | 12.0 h | 11.4 h |
What is the weather like in Sayulita in October?
In October, Sayulita is hot: daytime highs average 30 °C, and even at night it stays warm at around 22 °C. The sea averages 30.0 °C – almost as warm as a bath. The sun shines for around 7.7 hours a day. It is the rainy season: rain falls on about 13 days, totalling 112 mm. On about 17 days the thermometer climbs to 30 °C or more. The air is often humid and muggy. All in all, October is an excellent month for a holiday in Sayulita.
More details for October
- Daylight
- 11 h 42 min06:56 – 18:38
- UV index
- 9 · very highclear sky, noon (estimate)All months
- Muggy days
- 31 daysdew point 18 °C or moreAll months
- Wind
- 9 km/haverage daily peakAll months
- Cloud cover
- 55 %on averageAll months
- Hot days
- 17 days30 °C or moreAll months
- Time zone
- UTC−6offset from UTC
How the score comes together
- Temperatureweight 35 %100 %
- Seaweight 25 %100 %
- Sunshineweight 20 %78 %
- Few rainy daysweight 20 %37 %
Each factor is rated from 0 to 100 % and weighted for the travel style “Sun, sea & sand”.
What to pack in October
- Swimwear
- Sunscreen
- Sunglasses & sun hat
- Light, breathable clothes
- Water bottle – drink plenty
- Insect repellent
- Rain jacket or umbrella
Compare two months in Sayulita
Pick two months to see how the weather differs. A tick marks the clearly better value; for temperatures it depends on your plans.
March has the better holiday weather in Sayulita: score 100 against 83. In March, days are 2 °C cooler than in October. The sea is 6 °C cooler in March. March has 12 fewer rainy days. The sun shines an hour longer a day in March.
| Month | October | March |
|---|---|---|
| Holiday weather score | 83 | 100better |
| Daytime high | 30° | 28° |
| Night-time low | 22° | 17° |
| Sea | 30.0° | 24.2° |
| Sunshine | 7.7 h | 8.9 hbetter |
| Rainy days | 13 | 1better |
| Rainfall | 112 mm | 7 mmbetter |
| Muggy days | 31 | 13better |
Based on the climate averages 1996–2025.
Sayulita month by month
The typical weather for every month at a glance.
93January27° · Sea 25° · 7.0 h
In January, Sayulita is warm: daytime highs average 27 °C, and nights cool down to about 17 °C. The sea averages 25.0 °C – pleasant for swimming. The sun shines for around 7.0 hours a day. It hardly ever rains. The air is often humid and muggy. All in all, January is an excellent month for a holiday in Sayulita.
Sayulita in January96February27° · Sea 24° · 7.8 h
In February, Sayulita is warm: daytime highs average 27 °C, and nights cool down to about 17 °C. The sea averages 24.4 °C – pleasant for swimming. The sun shines for around 7.8 hours a day. It hardly ever rains. The air is often humid and muggy. All in all, February is an excellent month for a holiday in Sayulita.
Sayulita in February100March28° · Sea 24° · 8.9 h
In March, Sayulita is hot: daytime highs average 28 °C, and nights cool down to about 17 °C. The sea averages 24.2 °C – pleasant for swimming. The sun shines for around 8.9 hours a day. It hardly ever rains. All in all, March is an excellent month for a holiday in Sayulita.
Sayulita in March100April29° · Sea 25° · 9.0 h
In April, Sayulita is hot: daytime highs average 29 °C, and nights cool down to about 19 °C. The sea averages 24.9 °C – pleasant for swimming. With around 9.0 hours of sunshine a day, there is plenty of sun. It hardly ever rains. On about 8 days the thermometer climbs to 30 °C or more. The air is often humid and muggy. All in all, April is an excellent month for a holiday in Sayulita.
Sayulita in April100May31° · Sea 27° · 8.9 h
In May, Sayulita is hot: daytime highs average 31 °C, and even at night it stays warm at around 21 °C. The sea averages 26.8 °C – lovely and warm for swimming. The sun shines for around 8.9 hours a day. It hardly ever rains. On about 22 days the thermometer climbs to 30 °C or more. The air is often humid and muggy. All in all, May is an excellent month for a holiday in Sayulita.
Sayulita in May81June31° · Sea 28° · 6.8 h
In June, Sayulita is hot: daytime highs average 31 °C, and even at night it stays warm at around 23 °C. The sea averages 28.3 °C – lovely and warm for swimming. The sun shines for around 6.8 hours a day. It is the rainy season: rain falls on about 12 days, totalling 133 mm. On about 20 days the thermometer climbs to 30 °C or more. The air is often humid and muggy. All in all, June is an excellent month for a holiday in Sayulita.
Sayulita in June68July31° · Sea 30° · 5.8 h
In July, Sayulita is hot: daytime highs average 31 °C, and even at night it stays warm at around 23 °C. The sea averages 29.9 °C – almost as warm as a bath. Expect around 5.8 hours of sunshine a day. It is the rainy season: rain falls on about 21 days, totalling 199 mm. On about 26 days the thermometer climbs to 30 °C or more. The air is often humid and muggy. All in all, July is a good month for a holiday in Sayulita.
Sayulita in July70August31° · Sea 30° · 6.0 h
In August, Sayulita is hot: daytime highs average 31 °C, and even at night it stays warm at around 23 °C. The sea averages 30.4 °C – almost as warm as a bath. Expect around 6.0 hours of sunshine a day. It is the rainy season: rain falls on about 25 days, totalling 276 mm. On about 26 days the thermometer climbs to 30 °C or more. The air is often humid and muggy. All in all, August is a good month for a holiday in Sayulita.
Sayulita in August69September31° · Sea 30° · 5.8 h
In September, Sayulita is hot: daytime highs average 31 °C, and even at night it stays warm at around 23 °C. The sea averages 30.1 °C – almost as warm as a bath. Expect around 5.8 hours of sunshine a day. It is the rainy season: rain falls on about 25 days, totalling 263 mm. On about 20 days the thermometer climbs to 30 °C or more. The air is often humid and muggy. All in all, September is a good month for a holiday in Sayulita.
Sayulita in September83October30° · Sea 30° · 7.7 h
In October, Sayulita is hot: daytime highs average 30 °C, and even at night it stays warm at around 22 °C. The sea averages 30.0 °C – almost as warm as a bath. The sun shines for around 7.7 hours a day. It is the rainy season: rain falls on about 13 days, totalling 112 mm. On about 17 days the thermometer climbs to 30 °C or more. The air is often humid and muggy. All in all, October is an excellent month for a holiday in Sayulita.
Sayulita in October96November29° · Sea 28° · 7.7 h
In November, Sayulita is hot: daytime highs average 29 °C, and even at night it stays warm at around 20 °C. The sea averages 28.3 °C – lovely and warm for swimming. The sun shines for around 7.7 hours a day. Rain is rare: about 2 days bring 16 mm in total. On about 7 days the thermometer climbs to 30 °C or more. The air is often humid and muggy. All in all, November is an excellent month for a holiday in Sayulita.
Sayulita in November93December27° · Sea 26° · 6.9 h
In December, Sayulita is hot: daytime highs average 27 °C, and nights cool down to about 18 °C. The sea averages 26.1 °C – lovely and warm for swimming. The sun shines for around 6.9 hours a day. It hardly ever rains. The air is often humid and muggy. All in all, December is an excellent month for a holiday in Sayulita.
Sayulita in DecemberClimate in detail
Year & climate tableWarmest in July: 31°
Climate through the year
Long-term monthly averages. Tap a month to see its details.
Nights and sleep in Sayulita
How warm the nights get in each month, from the mean night-time low. Tap a month for details.
- Pleasant 15–20°
- Warm 20–24°
- muggy month (15+ muggy days)
WarmOctober: nights around 22°. Tropical nights: a fan or air conditioning helps. Muggy on about 31 days (dew point 18 °C or more).
The coolest nights are in February (17°), the warmest in July (23°). Tropical nights of 20 °C and more are the rule from May to November; then air conditioning or a fan helps you sleep. Nights are pleasant for sleeping (15 to 20 °C) from December to April. It is muggy (dew point 18 °C or more) on about 301 days a year, mostly all year round except in March.
Temperatures through the year
Average daytime high, night-time low and sea temperature per month.
| Month | Score | Day | Night | Sea | Sun | Rain days | Rain mm |
|---|---|---|---|---|---|---|---|
| JanuaryJan | 93 | 27° | 17° | 25.0° | 7.0 h | 2 | 10 |
| FebruaryFeb | 96 | 27° | 17° | 24.4° | 7.8 h | 2 | 18 |
| MarchMar | 100 | 28° | 17° | 24.2° | 8.9 h | 1 | 7 |
| AprilApr | 100 | 29° | 19° | 24.9° | 9.0 h | 0 | 1 |
| MayMay | 100 | 31° | 21° | 26.8° | 8.9 h | 1 | 3 |
| JuneJun | 81 | 31° | 23° | 28.3° | 6.8 h | 12 | 133 |
| JulyJul | 68 | 31° | 23° | 29.9° | 5.8 h | 21 | 199 |
| AugustAug | 70 | 31° | 23° | 30.4° | 6.0 h | 25 | 276 |
| SeptemberSep | 69 | 31° | 23° | 30.1° | 5.8 h | 25 | 263 |
| OctoberOct | 83 | 30° | 22° | 30.0° | 7.7 h | 13 | 112 |
| NovemberNov | 96 | 29° | 20° | 28.3° | 7.7 h | 2 | 16 |
| DecemberDec | 93 | 27° | 18° | 26.1° | 6.9 h | 2 | 16 |
Climate averages 1996–2025 (sunshine partly WMO station normals 1991–2020), not a forecast. Data: Copernicus ERA5 / ERA5-Land via Open-Meteo.com (CC BY 4.0), NOAA OISST, WMO 1991–2020 (NOAA NCEI), GeoNames (CC BY 4.0). Sources & licences
20.87° N, 105.44° W · 34 m · America/Bahia_Banderas
Sea temperatureUp to 30° in August
Sea temperature in Sayulita
Monthly sea surface temperature with the range of cooler and warmer years.
8 in 10 years: 29.3 – 30.6 °C
Swimming season: all year
- cold
- fresh
- refreshing
- pleasant
- warm
- very warm
The sea temperature in Sayulita ranges from 24.2 °C in March to 30.4 °C in August. At 20 °C and more, the sea is warm enough for swimming all year round.
The sea warms up slowly: it is warmest in August, while the air already peaks in July. The sea temperature varies from year to year: in August, eight out of ten years were between 29.9 and 30.9 °C.
| Month | Average | Cool year | Warm year | Feels |
|---|---|---|---|---|
| JanuaryJan | 25.0° | 23.5° | 26.4° | pleasant |
| FebruaryFeb | 24.4° | 23.3° | 25.7° | pleasant |
| MarchMar | 24.2° | 23.1° | 25.2° | pleasant |
| AprilApr | 24.9° | 23.8° | 25.7° | pleasant |
| MayMay | 26.8° | 25.7° | 27.7° | warm |
| JuneJun | 28.3° | 27.4° | 29.3° | warm |
| JulyJul | 29.9° | 29.1° | 30.6° | very warm |
| AugustAug | 30.4° | 29.9° | 30.9° | very warm |
| SeptemberSep | 30.1° | 29.3° | 30.7° | very warm |
| OctoberOct | 30.0° | 29.3° | 30.6° | very warm |
| NovemberNov | 28.3° | 27.4° | 29.3° | warm |
| DecemberDec | 26.1° | 24.0° | 27.3° | warm |
Sunshine2,690 hours a year
Sunshine hours in Sayulita
Average hours of bright sunshine per day, next to the length of the day. Tap a month to select it.
In October, the sun shines for about 7.7 of 11.7 hours of daylight in Sayulita, 66 % of the daylight hours.
Sunshine hours: estimated from radiation data (ERA5, 1996–2025) and calibrated against measured station values; no weather station is close enough here. Daylight is the time from sunrise to sunset on the 15th of the month.
Rain1,053 mm a year, most in August
Rain in Sayulita: rainy days and rainfall
A rainy day is a day with at least 1 mm of rain or snow; the amount is what falls in the whole month. Tap a month to select it.
In October, Sayulita has about 13 rainy days with 112 mm of rain in total.
UV indexUp to 12 in July
UV index in Sayulita
How strong the sun is at noon, month by month, and how quickly unprotected skin burns.
- Clear-sky UV in October
- 9 · very highStay in the shade around midday; SPF 50, clothing, hat and sunglasses.
The sun is strongest in July (UV 12).
Minutes until sunburn in October
- Very fair skin
- about 15 min
- Fair skin
- about 20 min
- Light brown skin
- about 25 min
- Olive skin
- about 35 min
Rough guide for unprotected skin at noon under a clear sky; clouds lengthen the time, water, sand and snow shorten it. Sunscreen extends the time only partly.
Monthly values: clear-sky noon estimate from the sun's angle, ozone and altitude. UV today: Open-Meteo forecast.
Wind & cloudsWindiest in May: 12 km/h
Wind and clouds in Sayulita
How breezy and how cloudy Sayulita is through the year. Tap a month to select it on the whole page.
Wind
Typical daily peak of the wind in km/h: what the afternoon breeze usually reaches, not the gusts.
In October, the wind in Sayulita typically peaks at 9 km/h during the day: Beaufort 2, light breeze or less.
Breezy months for windsurfing and kiting
The daily breeze rarely reaches Beaufort 4 (20 km/h), so wind sports depend on single windy days.
Clouds
Average share of the sky covered by cloud, day and night.
In October, cloud covers on average 55 % of the sky over Sayulita: variable cloud, with about 7.7 hours of sunshine a day.
Wind: mean daily maximum of the hourly wind 10 m above ground (ERA5, 1996–2025). Gusts are stronger, and the model grid of about 28 km smooths out local effects such as capes and valley winds. Clouds: mean total cloud cover of all layers over day and night (ERA5, 1996–2025). Thin high cloud counts as cover even when the sun still shines through.
Heat & humidity151 days of 30° or more a year
Heat and humidity in Sayulita
How often the day gets hot in Sayulita (30 °C and more), and in which months heat and humidity come together. Tap a month to select it.
Heat calendar
- pleasant
- some hot or muggy days
- often muggy
- often hot
- hot and muggy
In October, Sayulita has about 17 hot days, with an average daytime high of 30 °C: hot and muggy. Plan outdoor activities for the morning and evening, drink a lot and take breaks in the cool.
Hot days reach at least 30 °C; a month counts as muggy when the mean dew point reaches 18 °C on at least 15 days. Averages from ERA5 and ERA5-Land, 1996–2025. Muggy nights through the year
Planning a trip to Sayulita
Weather for your travel dates
Pick your arrival and length of stay, and we sum up the weather to expect.
Sayulita in the school holidays
How the weather suits the usual holiday periods. Dates vary by school and region, so each holiday uses the months it usually falls in.
Sayulita has its best school-holiday weather during the Easter holidays (score 100) and its weakest during the summer holidays (score 69).
- 100
Easter holidays
Mar – Apr
ExcellentBest holidays
- 29 °C by day
- Sea 25 °C
- 9.0 h of sun a day
- 0 rainy days a month
Good for: Beach & swimming
- 96
May half-term
May – Jun
Excellent
- 31 °C by day
- Sea 27 °C
- 8.5 h of sun a day
- 3 rainy days a month
Good for: Beach & swimming
Keep in mind: Storm season
- 69
Summer holidays
Jul – Aug
Good
- 31 °C by day
- Sea 30 °C
- 5.9 h of sun a day
- 24 rainy days a month
Keep in mind: Frequent rain, Storm season
- 83
October half-term
Oct
Excellent
- 30 °C by day
- Sea 30 °C
- 7.7 h of sun a day
- 13 rainy days a month
Keep in mind: Frequent rain, Storm season
- 93
Christmas holidays
Dec – Jan
Excellent
- 27 °C by day
- Sea 26 °C
- 7.0 h of sun a day
- 2 rainy days a month
Good for: Beach & swimming, Sightseeing & walks
Based on the climate averages 1996–2025.
Getting there
Flying from
- Nonstop flight
- about 11 h 35 min
- Distance
- 9,190 km
- Time zone
- UTC−6
- Jet lag
- About 5 days (7 h west)
Rule of thumb for flying west: for a few days before, stay up a little later, and get afternoon and evening light at your destination.
Most routes need a change of planes, which adds time.
Estimated from the straight-line distance: 30 minutes for take-off and landing plus 830 km/h cruising speed.
Good to know: Mexico
- Currency
- Mexican Peso (MXN)
- Language
- Spanish
- Sockets
- Type A, B · 127 V
- Traffic
- Drives on the right
- Dialling code
- +52
- Emergency number
- 911
UK plugs need a travel adapter
Only 127 V: chargers marked 100–240 V work, other devices need a voltage converter.
Sources: GeoNames (CC BY 4.0) and Wikidata (CC0). Please check details before you travel.
Storm season
Sayulita lies in an area that Eastern Pacific hurricanes can reach. The hurricane season runs from May to November, with most storms from August to September. A direct hit on any one place is rare, but if you travel then, keep an eye on weather warnings and book flexibly.
- January
- February
- March
- April
- May: Season
- June: Season
- July: Season
- August: Peak
- September: Peak
- October: Season
- November: Season
- December
Official season dates of the regional warning centres (NOAA, JMA, IMD, Météo-France, BoM, Fiji Meteorological Service); not a forecast.
Compare & alternatives
Compare with another place
Sayulita compared
Put Sayulita side by side with another destination.
Sayulita vs Puerto Vallarta
In October Sayulita has the better holiday weather (score 83 vs 75). During the day it is about as warm in Puerto Vallarta as in Sayulita. The sea is about equally warm.
| in October | Sayulita | Puerto Vallarta |
|---|---|---|
| Holiday weather score | 83 | 75 |
| Daytime high | 30° | 30° |
| Sea | 30° | 30° |
| Sunshine | 8 h | 8 h |
| Rainy days | 13 | 18 |
| Best time | Nov – May | Nov – May |
Through the year
Best places in the country
Mexico in October: the best places
In October, Sayulita ranks 12 among the 31 nearest destinations in this country.
- Todos Santos31°28°100
- 2Durango26°98
- 3Aguascalientes City26°92
- 4León de Los Aldama27°91
- 5Zacatecas20°89
- 6San Miguel de Allende26°89
- 7San José del Cabo33°29°89
- 8Cabo San Lucas33°29°88
- 12SayulitaThis page30°30°83
Places nearby4 places within 203 km
Near Sayulita
Other destinations close by.
Places with a similar climatee.g. Mazatlán and Manzanillo
Places with a climate like Sayulita
Destinations whose weather through the year is closest to Sayulita's – good alternatives.
Frequently asked questions about Sayulita
When is the best time to visit Sayulita?
The best time to visit Sayulita is from November to May. That is when the holiday weather score, which combines temperature, sea, sunshine and rain, is highest.
How warm is the sea in Sayulita?
The sea temperature in Sayulita ranges from 24.2 °C in March to 30.4 °C in August. At 20 °C and more, the sea is warm enough for swimming all year round.
Can you swim in Sayulita in October?
Yes. In October the sea averages 30.0 °C – almost as warm as a bath.
What is the warmest month in Sayulita?
July is the warmest month, with average highs of 31 °C and nights around 23 °C. January is the coolest month at 27 °C.
When does it rain most in Sayulita?
The rainy season is from June to October; the wettest month is August with 276 mm. The driest month is April with 1 mm.
How many hours of sunshine does Sayulita get?
Sayulita gets around 2,690 hours of sunshine a year. The sunniest month is April with 9.0 hours a day; in July there are 5.8 hours a day.
What time zone is Sayulita in?
Sayulita is on UTC−6 all year.
How long is the flight from London to Sayulita?
A nonstop flight from London to Sayulita takes about 11 h 35 min, for a straight-line distance of about 9,190 km. Most routes need a change of planes, which adds time.
When is hurricane season in Sayulita?
Sayulita lies in an area that Eastern Pacific hurricanes can reach. The hurricane season runs from May to November, with most storms from August to September. A direct hit on any one place is rare, but if you travel then, keep an eye on weather warnings and book flexibly.
Which school holidays are best for Sayulita?
Sayulita has its best school-holiday weather during the Easter holidays (score 100) and its weakest during the summer holidays (score 69). Holiday ratings (0–100): Easter holidays 100, May half-term 96, summer holidays 69, October half-term 83, Christmas holidays 93.